Module 5. Designing Your Own Humanities Data Model
Course 3. Modeling Meaning: How We Structure Humanities Data
Estimated Time: 40+ minutes
🧭 Module Objectives
- Outline a conceptual data model for a humanities topic or collection.
- Identify appropriate entities, relationships, and attributes.
- Define key contextual and interpretive dimensions for your model.
- Translate your conceptual model into a visual diagram or schema.
- Reflect critically on how your design choices express meaning and perspective.
From Concept to Model
In previous modules, you learned how data models represent meaning:
- Module 1 defined modeling as a translation between the world and data.
- Module 2 introduced the building blocks of structure.
- Module 3 compared ways of representing knowledge.
- Module 4 explored context, ambiguity, and ethics.
Now, you'll bring these ideas together, designing a small but thoughtful data model of your own!
Step One: Choose Your Focus
Select a humanities subject you care about. It might be:
- An artist (e.g., Taylor Swift, Nina Simone, Van Gogh, Picasso)
- A text (a novel, poem, or collection)
- A place (a city, heritage site, or digital archive)
- An event (e.g., the US Civil War, bombing of Pearl Harbor, last week's mac-and-cheese dinner)
- A theme (migration, protest, love, identity, technology)
Ask yourself: "What aspects of this subject do I want to understand, compare, or reveal?" This guiding question will shape what your model needs to represent.
Step Two: Identify the Core Entities
List 3–6 key entities (the "nouns") your model will include. For example, in a Wellespring context:
| Entity | Description |
|---|---|
| Song | A musical work written or performed by an artist |
| Person | A songwriter, performer, collaborator, or any other human |
| Theme | A recurring idea expressed through lyrics |
| Event | Any actual event, including live performances |
| Reaction | A listener response, review, or social media post |
Each entity type should represent a category of meaning relevant to your project: something you might want to connect, analyze, or visualize later.
Step Three: Define Relationships
Next, describe how these entities connect—this is where you add in your verbs.
| Relationship | From → To | Meaning |
|---|---|---|
| WROTE_SONG | Song → Person | Identifies a song's writer |
| EXPRESSES | Song → Theme | Indicates that a song embodies a theme |
| PERFORMED_DURING | Song → Event | Links a song to a specific performance |
| MENTIONED_IN | Song → Reaction | Shows audience engagement or discourse |
Keep relationships directional and meaningful. Ask yourself: "What do I want these connections to say about the cultural world I'm studying?"
Step Four: Add Attributes
Each entity and relationship can have attributes: descriptive details.
| Entity | Example Attributes |
|---|---|
| Song | title, releaseDate, length, mood |
| Person | name, birthYear, role, location |
| Theme | name, category, sentiment |
| Event | date, place, audienceSize |
| Reaction | platform, tone, keywords |
Attributes let you filter and compare, e.g., "show all songs with positive sentiment performed at Farm Aid."
Step Five: Sketch the Model
Use a pencil and paper, a whiteboard, or a simple digital diagramming tool (e.g., arrows.app, draw.io, Lucidchart, or even PowerPoint). Start with nodes (circles) for entities, draw arrows for relationships, and label them clearly.
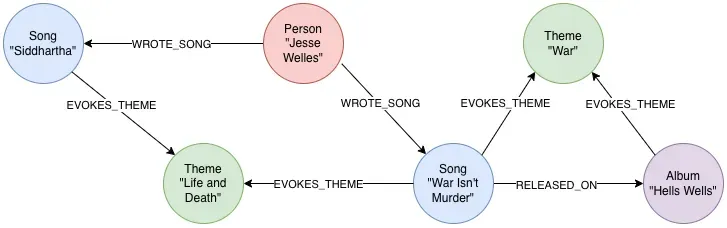
Add a few key attributes under each node to show what distinguishes each instance. This diagram is your conceptual schema: the blueprint for later database design.
Step Six: Reflect on Interpretation and Ethics
Every modeling decision carries interpretive weight:
- Why did you include some entities and not others?
- What does your choice of relationships suggest about causality or influence?
- How do you represent ambiguity, or avoid claiming more than you know?
Document your reasoning in a brief reflective paragraph. This is the humanist's equivalent of metadata for your model: transparency about perspective and purpose.
Step Seven: Share and Compare
If you're completing this course with peers or classmates, exchange models and discuss:
- What patterns or insights does each reveal?
- What questions or blind spots emerge?
- How might your models complement or contradict each other?
In the Wellespring Project, this dialogic process mirrors how knowledge graphs evolve collaboratively: different voices contributing to a richer picture of cultural meaning.
Looking Ahead: From Model to Graph
In our next course, Building Graphs in Neo4j, you’ll learn to:
- Implement your model in a real graph database.
- Create and query nodes, relationships, and properties.
- Visualize your network to uncover patterns and stories.
Your conceptual model here will serve as the foundation for that technical work. Modeling meaning is the art of thinking relationally; graphing meaning is the act of building it interactively.
Key Takeaways
- A good humanities data model begins with clear purpose and interpretive transparency.
- Entities, relationships, and attributes should emerge from meaningful questions.
- Visual modeling helps reveal structure, gaps, and potential insights.
- Reflection ensures ethical awareness and contextual depth.
- Your model is both a research tool and a scholarly argument.
Knowledge Check & Reflection
Suggested Readings & Resources
The following resources provide practical examples of using various online tools to create data model entity-relationship diagrams:
Jones, Alistair, and Irfan Nuri Karaca. "Drawing Graphs with Arrows.App." Neo4j Developer Blog, Medium, 2021.
Lucid. "What Is an Entity Relationship Diagram (ERD)?" Lucidchart.
Miro. "Quick Diagramming." Miro Academy.
Neo4j. "Online Course: Graph Data Modeling Fundamentals." Neo4j GraphAcademy.