Module 5. Querying and Visualizing Your Graph
Course 4. Building Graphs in Neo4j
Estimated Time: 45–60 minutes
🧭 Module Objectives
- Use the Cypher query language to retrieve data with
MATCH,WHERE, andRETURN. - Filter and sort results to answer meaningful questions about your data.
- Visualize query results as interactive networks.
- Customize the graph display to highlight important relationships.
- Reflect on how querying transforms data into interpretation.
From Building to Exploring
You now have a small network of nodes and relationships in your Neo4j Aura database. But how do we ask questions of this data? How do we explore connections, patterns, and meanings?
That's where queries come in. Neo4j uses Cypher, a simple but powerful language designed to make questions read like sentences.
If SQL (the language of relational databases) is like asking a bureaucrat for a record, Cypher is like tracing a map of relationships yourself.
The MATCH–WHERE–RETURN Pattern
Most Cypher queries follow this pattern:
MATCH (node)-[relationship]->(otherNode)
WHERE some condition
RETURN node, relationship, otherNode
Let's practice with what you've already built.
Example 1: Return Everything
MATCH (n)
OPTIONAL MATCH p=()-[]-()
RETURN n, p;
This is the "show me everything" command. It displays every node (the MATCH (n) RETURN n part does this) and every relationship in your graph (the OPTIONAL MATCH p=()-[]-() RETURN p part does this, with the OPTIONAL statement allowing the full query to run even if no relationships are found in the database).
In this case we've used the letter "n" as a variable for the first MATCH, because the items we want to return are nodes and "nodes" start with the letter "n." We've also used the letter "p" as a variable for the OPTIONAL MATCH because we are asking the system to find everything that matches the pattern of two nodes connected by a relationship; "p" here stands in for "pattern." We could have used any alphanumeric string for these variables but it's best to keep things simple and as intuitive as possible. Most importantly, the variables need to make sense to YOU!
Example 2: Find All Songs
MATCH (s:Song)
RETURN s, s.title, s.year;
This retrieves only the nodes labeled Song, returning the full nodes (RETURN s) along with specific columns for their title and year properties (RETURN s.title, s.year). After running the query, try switching the Results Frame between "Graph," "Table," and "RAW" views in order to see each representation.
Example 3: Find Who Wrote Each Song
MATCH (p:Person)-[:WROTE_SONG]->(s:Song)
RETURN p.name AS SongWriter, s.title AS SongTitle;
In more natural English, this query says: "Match each person connected to a song by a WROTE_SONG relationship, and return the person names and song titles."
In this case, p.name refers to the "name" property attached to the Person node, while s.title refers to the "title" property attached to the Song node. These make sense to the database and might make sense to us as the person writing and executing the query, but they're not the most user-friendly. To improve the readability of our results, we use the AS keyword to rename them to "SongWriter" and "SongTitle."
Run this query in your own instance and compare the Results Frame to the results of our previous query. Do you notice anything different? Compare the results and how they are displayed to you carefully. Try to figure out what the big difference is. Once you've spotted the difference, look at the two queries and try to figure out why this is happening. You can open the toggled section below to check your answer.
What's different? Open me for the answer.
When we ran Example 2's Find All Songs query, the Results Frame allowed us to see the results in Graph, Table, and RAW views. For Example 3's Find Who Wrote Each Song query, though, we only have the Table and RAW view options. Why?
The reason is that in Example 2's query, we specified that we wanted our results to include the full Song node as well as its title and year properties, but in Example 3's query, we are asking only for the Person name and Song title properties. If we wanted to see Example 3's results in Graph view, we would have to modify our query to something like:
MATCH (p:Person)-[r:WROTE_SONG]->(s:Song) RETURN p, r, s, p.name AS SongWriter, s.title AS SongTitle;
This includes a few key additions: we've added the "r" variable to the relationship in our MATCH statement and added p, r, and s to our RETURN statement. Try running this version to see how the Graph view now becomes available. This is nice, but may not be necessary if we really only want the relevant properties.
Filtering with WHERE
The WHERE clause lets you narrow down your results, filtering based on the value of specific properties in either nodes or relationships,
Example 4: Songs Released After 2020
MATCH (s:Song)
WHERE s.year > 2020
RETURN s.title, s.year;
If you've only entered the data we've walked through so far, this will return only one song: "War Isn't Murder." In reality, our database includes another song written after 2020 ("Horses") but we haven't yet recorded the year for this song. So, it is important to note that your queries can only return records where the relevant data is present within your database.
Example 5: Songs About a Specific Theme
MATCH (s:Song)-[:EVOKES]->(t:Theme)
WHERE t.name = "Protest"
RETURN s.title, s.year, t.name;
Now you're beginning to analyze meaning, not just structure.
Combining Paths
So far, we've only searched for specific nodes and those that are connected by direct relationships. But what about identifying nodes that are connected through longer chains of relationships? This is where the graph data model is particularly powerful, allowing us to match—or 'traverse'—long chains or relationships in order to explore deeper connections.
Example 6: Songwriters and Themes
MATCH (p:Person)-[r1:WROTE_SONG]->(s:Song)-[r2:EVOKES]->(t:Theme)
RETURN p, r1, s, r2, t, p.name AS SongWriter, s.title AS Song, t.name AS Theme;
Try running that and switching to the Graph view. You'll see how relationships form meaningful chains: a visual map of creation and expression.
You may note that since our Cypher query includes two relationships (WROTE_SONG and EVOKES), we assigned a different variable (r1 and r2) to each of them, and made sure that we asked the database to return both of these in the result set. If we omitted one of these, our graph view would not display that relationship.
Visualizing and Customizing the Graph
Aura Console's Graph View is fully interactive. Here are some of the things you can do:
| Action | Description and Helpful Tips |
|---|---|
| Drag Nodes | Click and drag to rearrange node positions and the distance between them. This only affects their TEMPORARY position within the visualization and doesn't change any underlying data. |
| Zoom | Scroll your mouse wheel OR click the "zoom in" "zoom out" |
| Recenter / Fit to View | Click the "zoom to fit" icon your graph view with all nodes/relationships (from your query's result) showing. |
| Inspect Details | In Graph view, there is an icon corner of the Results Frame which can be used to toggle a side panel for details about the graph and any selected node or relationship. If this panel is not visible, click the icon to open it and then single- click any node or relatioship in the graph. You will now see any properties that are recorded for that node/ relationship. The same icon can be clicked to collapse this panel. |
| Color / Style the Graph | When the Graph view side panel is open (see above), you can customize how your graph displays, setting your own preferences for how you want nodes and relationships to appear, customizing color, size, and which property to display as a caption. If any of your nodes happen to have more than one Label (this shouldn't be the case for anything in your database yet!), you can also specify which styles you want to take priority. |
| Expand Graph Network | By default, the Graph view displays only the nodes and relationships that specifically match your query. You can expand this, however, by double-clicking on any visible node to see its other direct relationships. You can continue doing this with any nodes that are added to the view, tracing the network of connections as far as you'd like (and as far as your database is aware of these relationships). This is a very powerful feature of graph databases and Neo4j implements this well. |
Spend some time trying all of these features out. As you do so, think about how a clear visual layout helps to reveal structure and meaning, just like arranging evidence on a research board. We'll cover more advanced visualization topics in a future course.
Saving and Rerunning Queries
As already mentioned, the Aura Console automatically remembers your most recent commands and queries. Those from your current session are located in the Results Stream, but even older ones can be accessed in the Query Tool's History drawer:
- Access this by clicking the History icon
 in the Query Tool Nav.
 - Look through your query history. Do you remember running some of these? Do any make a bit more sense now that you've been working with Neo4j a bit more? It's very helpful to think about these types of questions and to revisit past queries and actions reflectively.
- Choose one of your past queries. You'll see that it is automatically placed in your Cypher Editor bar. Go ahead and re-run it. Did you get the same results? If not, what has changed? (you might have more results if we've added new nodes/relationships since your last run of this command/query)
Remember that you can also save queries and commands, organizing them however you'd like. With a query or command in the Cypher Editor, click the "More Options" icon ![]() located just to the left of the "Run" icon, and choose "Save Cypher." You can give this a name (make it short but meaningful) and select a "folder" that you want to save it to within your Saved Cypher library. Remember: you can access and organize all of your saved queries/commands by accessing the "Saved Cypher" drawer
located just to the left of the "Run" icon, and choose "Save Cypher." You can give this a name (make it short but meaningful) and select a "folder" that you want to save it to within your Saved Cypher library. Remember: you can access and organize all of your saved queries/commands by accessing the "Saved Cypher" drawer ![]() on the Query Tool Nav. This is very helpful to both new users who are just getting started with Neo4j/Cypher and to experienced veterans who can save time and energy by storing frequently-run and/or complex queries that took significant thought and effort to initially create.
on the Query Tool Nav. This is very helpful to both new users who are just getting started with Neo4j/Cypher and to experienced veterans who can save time and energy by storing frequently-run and/or complex queries that took significant thought and effort to initially create.
Interpreting Your Graph
Let's refresh our Results Stream. We'll start by clearing everything. Do you remember how to do this? Give it a try without looking below. Hint: we covered this in Module 3 of this course.
Open me to see how to clear the Results Stream
To clear the results stream, we enter the following simple command into the Cypher Editor:
:clear
Click the "Run" icon or use the appropriate keyboard shortcut for your platform and browser.
Now, let's return everything in our database. Do you remember how to do this? Give it a try without looking below. Hint: we covered this near the very beginning of this module.
Open me to see how to return all items in the database
As we covered in Example 1 at the top of this module, we can do this by running the following statement in the Cypher Editor:MATCH (n)OPTIONAL MATCH p=()-[]-()RETURN n, p;
Click the "Run" icon or use the appropriate keyboard shortcut for your platform and browser.
Once your graph loads, take a moment to look at the graph visualization again. Ask yourself:
- What clusters or hubs do I see?
- Are there relationships that repeat or stand out?
- Which nodes seem most central? And why?
- Given what I know about the Wellespring Project, which nodes are most likely to increase in number? And which relationships?
- Based on this graph alone, what additional information should be added? This might be additional nodes of types that already exist (e.g., additional songs), new node types that are not currently in the database, new relationship types, additional properties, etc..
- How does the graph visualization help you to think through the data, its connections, and additional possibilities in a way that a spreadsheet wouldn't?
These are the first steps toward graph thinking, using structure to guide interpretation. In the Wellespring Project, this might mean identifying recurring themes across songs, tracing the spread of influences, or mapping emotional arcs.
Challenge Exercise
Using the information you've learned in this and the previous modules, try to write a Cypher statement (or a collection of Cypher statements) that will add the following information to your database:
Don't worry if this is difficult and don't give up if your first try or two doesn't work. Persistence is key. Look through our previous commands—they're all in this module, above ↑, or in module 4, and if you've followed along you should be able to find them all in your Aura Console's cypher history—for clear working examples of everything that you need in order to complete this challenge. Hint: you will mostly be create-ing new nodes and relationships but you'll also need to match at least one node that already exists in our database.
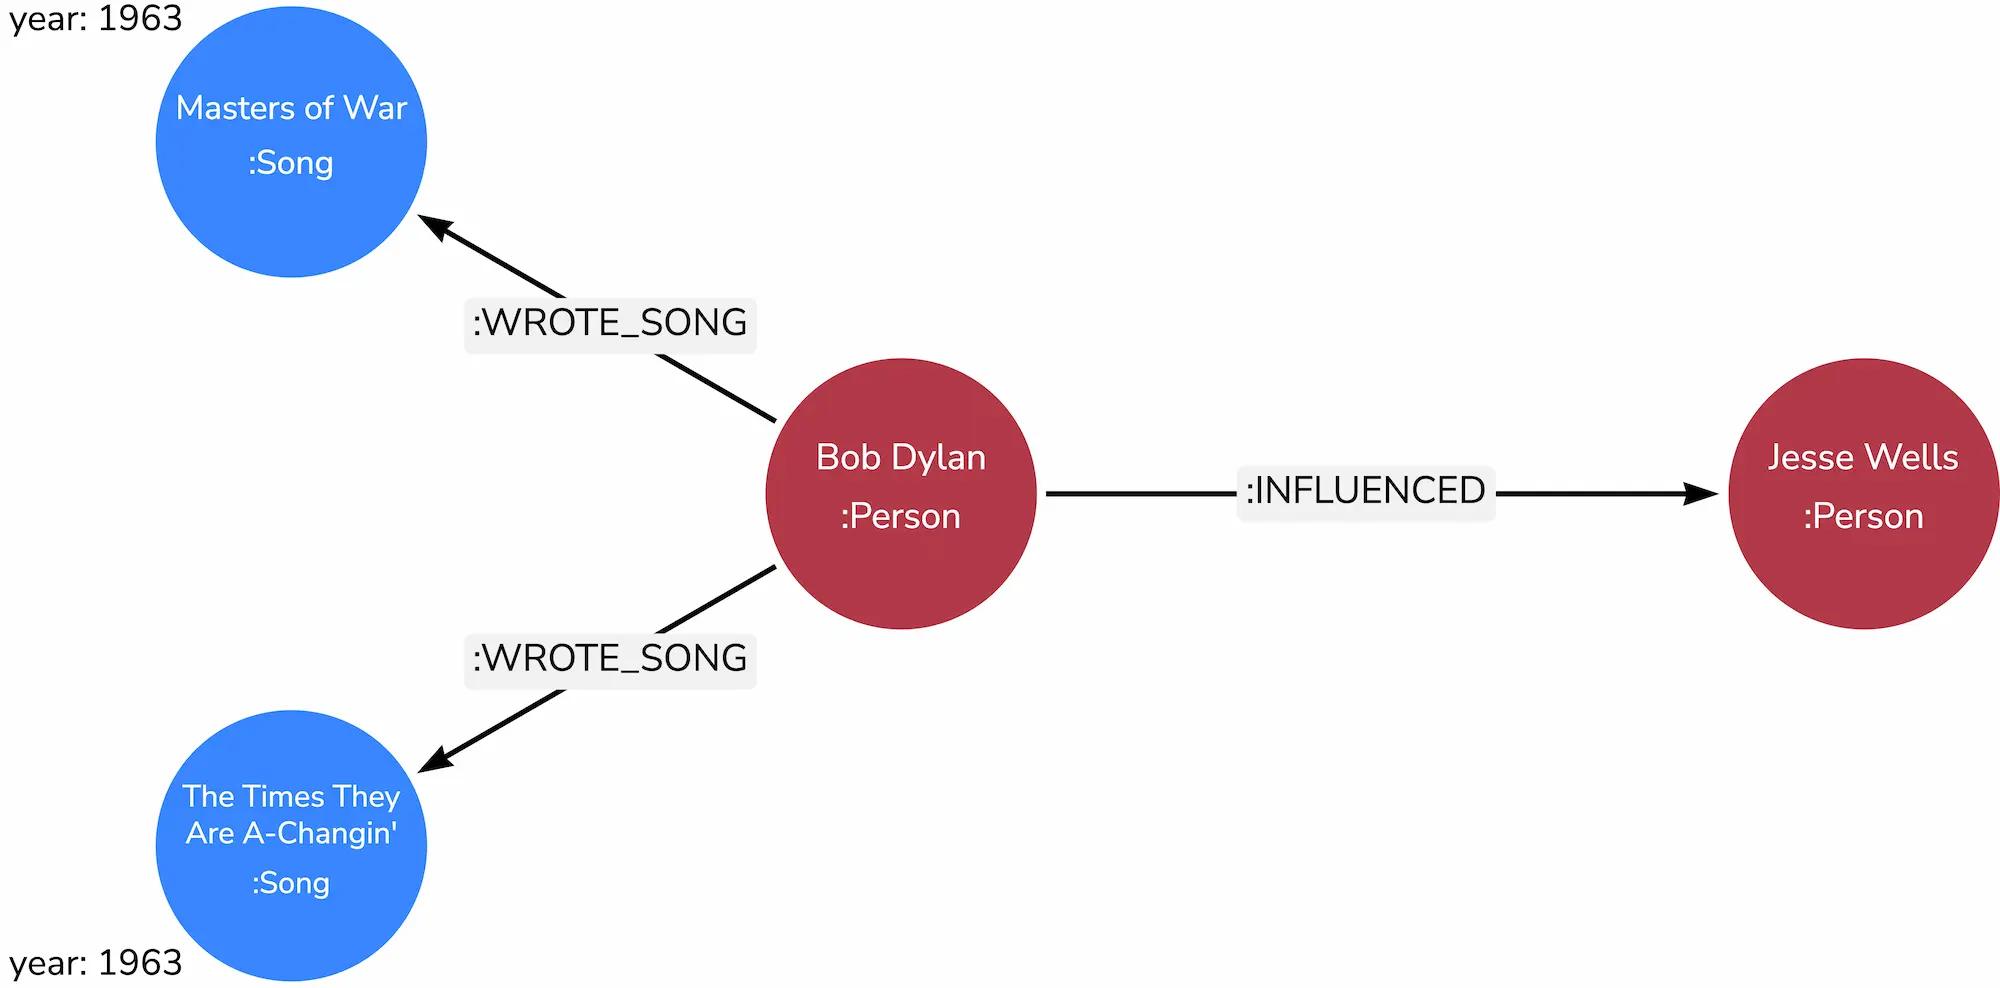
Once you've succeeded in adding these nodes, relationships, and properties to your graph, use the knowledge you've gained in this module to write a Cypher query that returns all people in the database that are influenced by Bob Dylan. Again, don't give up if you find it a bit difficult. The examples on this page give you all the information you need to form this query.
If you succeeded: Congratulations! You've just performed a basic network analysis query!
If you're still struggling and can't make it work: Keep trying! Reread this module's examples carefully and try each of them several times before moving on. Come back to this challenge when you think you've figured it out. If you still can't figure it out, go back to module 3 and work through the course a little slower. Think about what is happening at every step. You might need to run through these modules a few times before things "click" for you.
Key Takeaways
MATCHfinds patterns in the graph.WHEREfilters results by property or condition.RETURNdetermines what you see in the output.- Graph visualization helps you think relationally: seeing data as connected stories.
- Querying turns static data into active interpretation.
Knowledge Check & Reflection
Suggested Readings & Resources
- GraphAcademy "Cypher Fundamentals" course
- GraphAcademy "Graph Data Modeling Fundamentals" course
- Neo4j Aura Documentation
- Neo4j Cypher Cheat Sheet
- Merki Sasaki, Bryce, and Joy Chao. Graph Databases for Beginners. Neo4j, 2021.
- Robinson, Ian, Jim Webber, and Emil Eifrem. Graph Databases: New Opportunities for Connected Data. Second edition. O’Reilly Media, 2015.